DONE! You can download all your data and files here.
Please note that your data and this page will be kept on the server for a week.
Contents
- Pathway/GO terms enrichment analysis
- Peptide clustering analysis
- Kinase/Phosphatase-phosphopeptides relationships
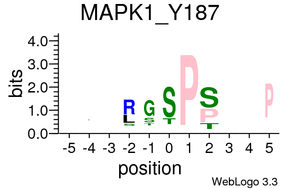
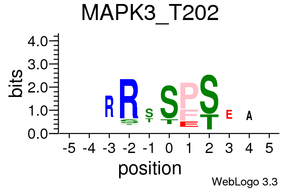
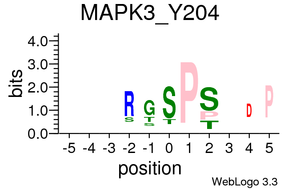
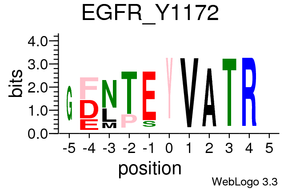
- Motif Analysis
- Cytoscape networks
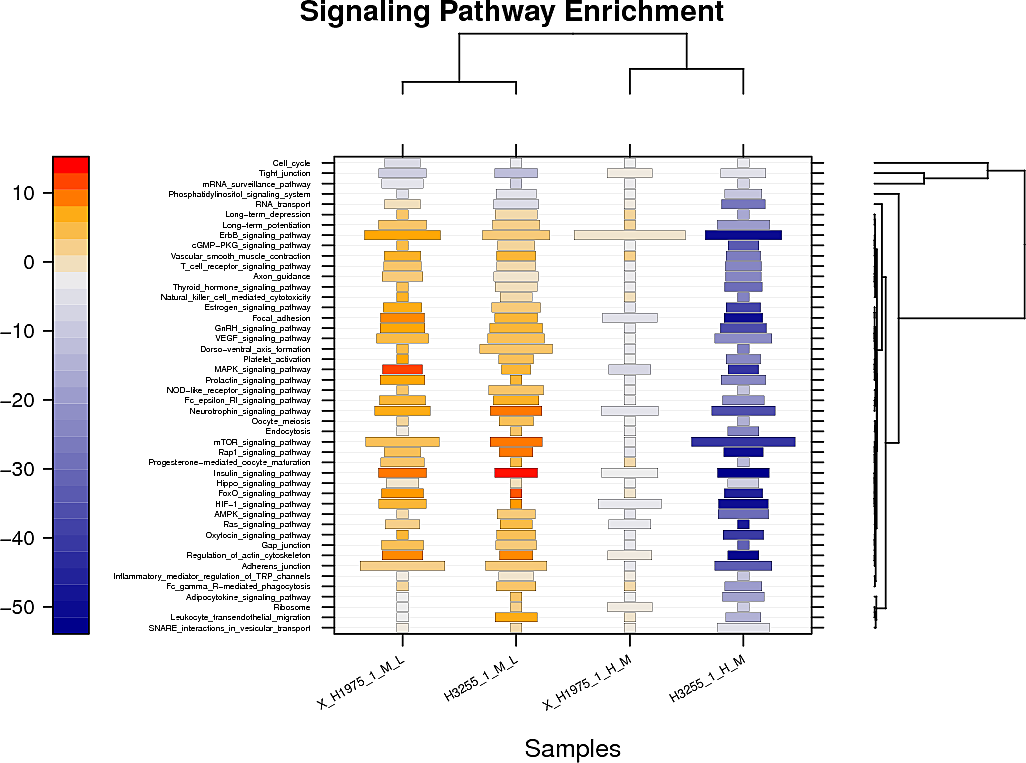
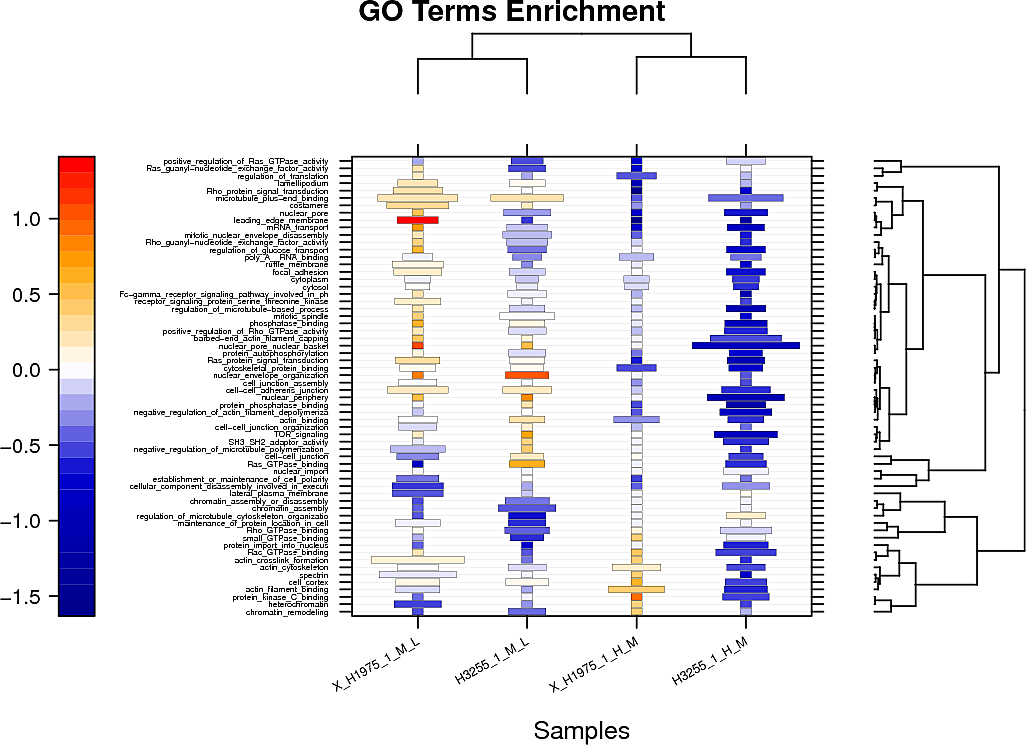
Pathway and GO terms enrichment analysis
Below are displayed the signaling pathways and GO terms (top hits only) that are enriched amongst your changed peptides for each sample.
The color represents the additive log change of the peptides in this pathway/GO term and the size of the box the odds ratio of the enrichment.
For the raw tables and the plots showing the full set of pathway/GOterm enrichment in pdf format check the links provided above the plots:
You seem to only have 4 data points. SELPHI will use the pearson correlation coefficient for your analysis.
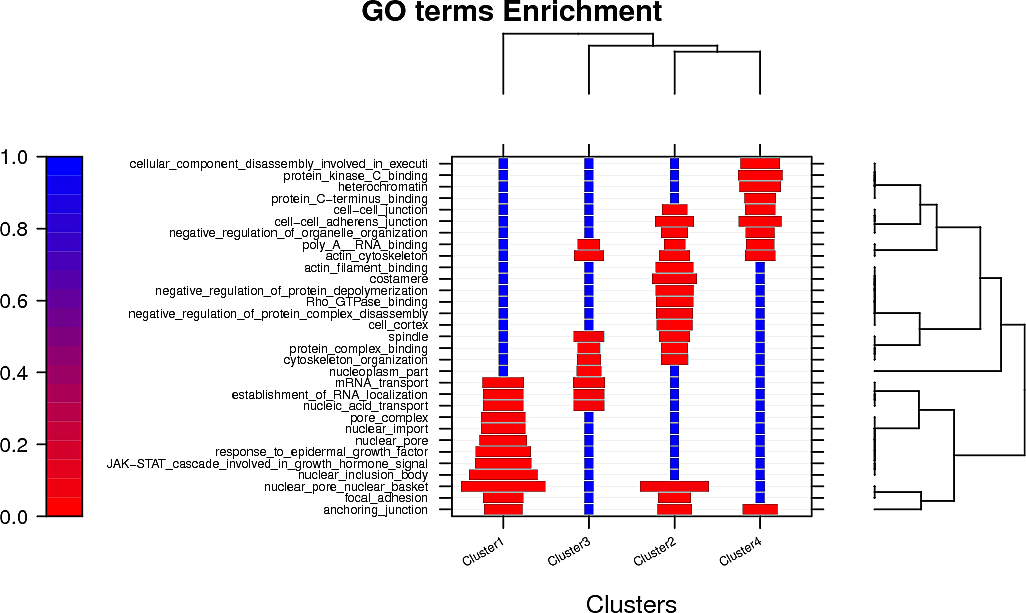
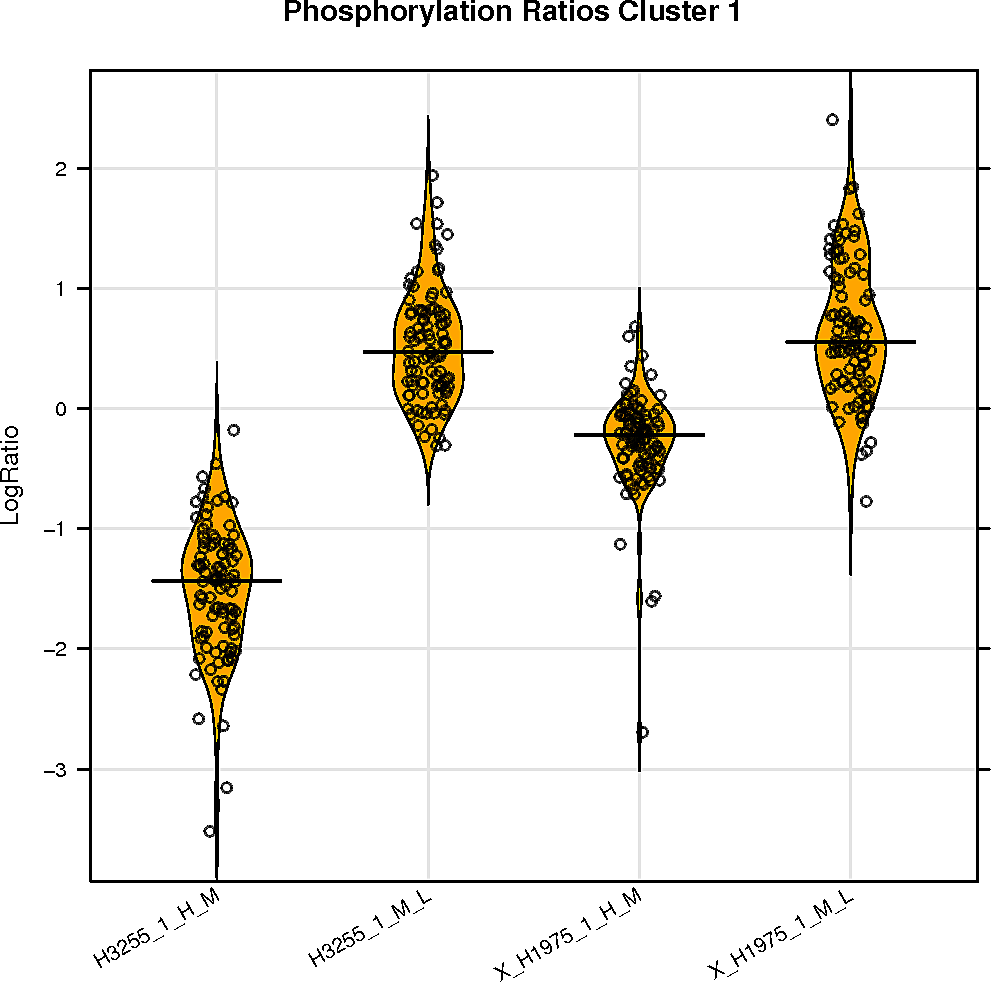
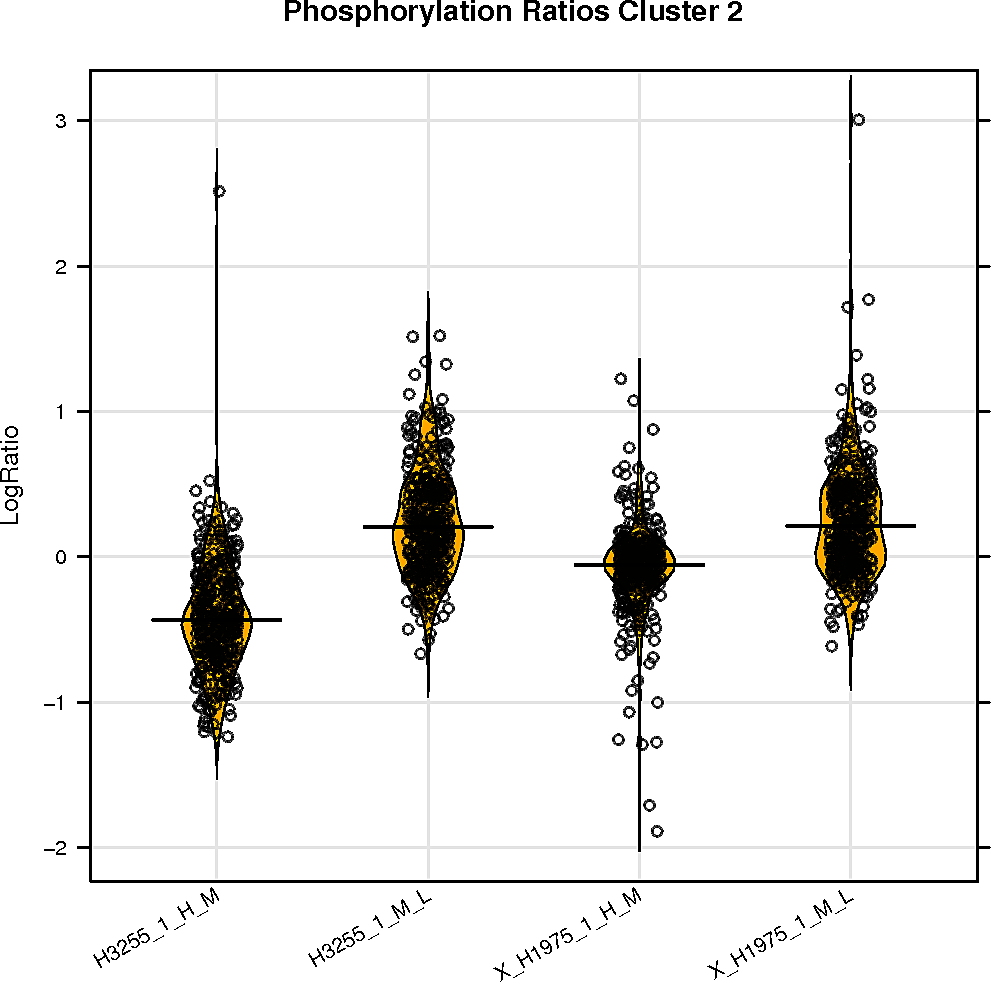
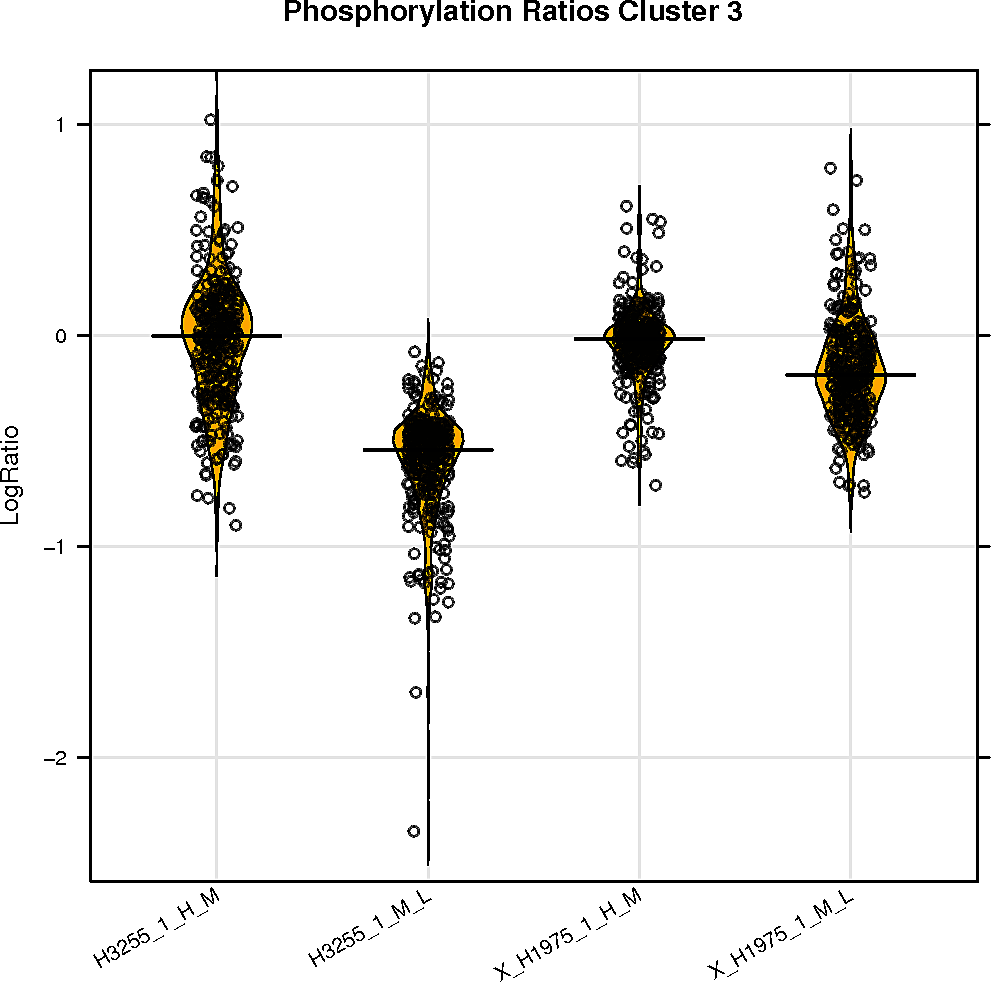
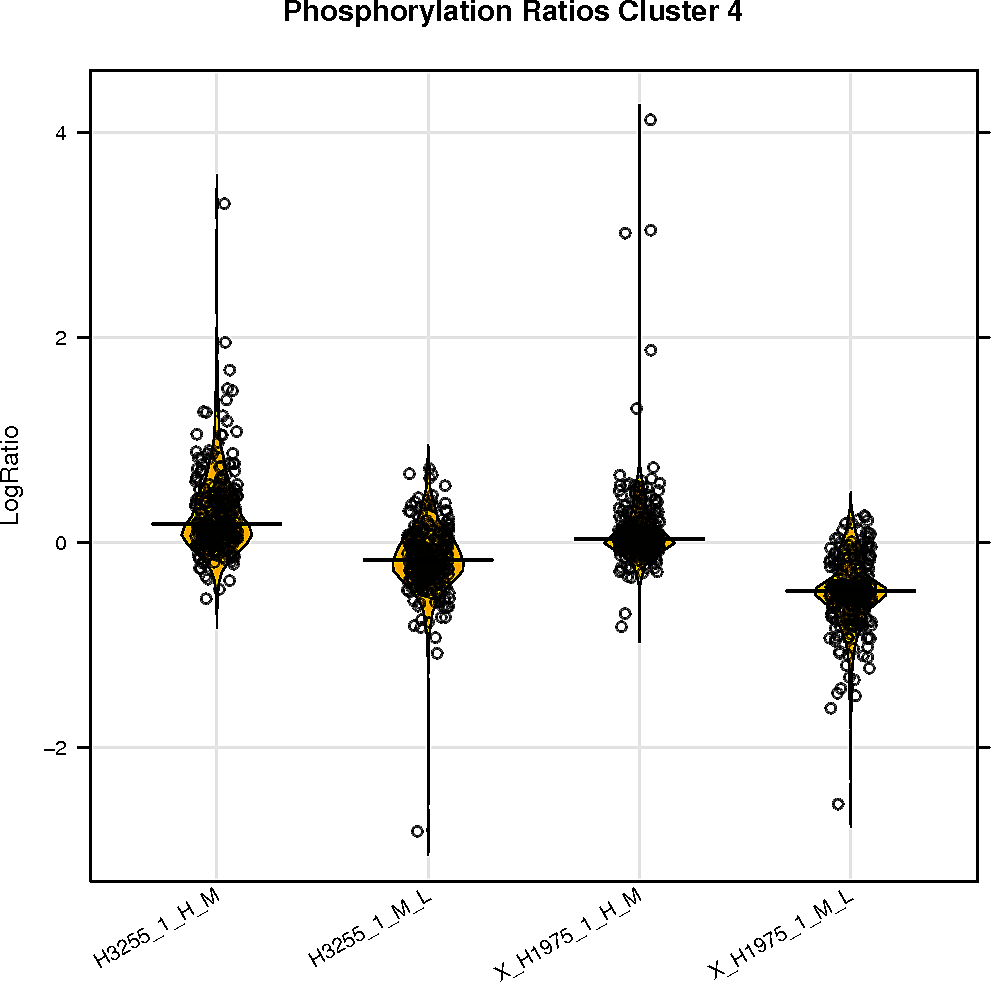
Peptide clustering analysis
Below are displayed the GO terms that are enriched in the clusters of your peptides if there is more than one cluster.
The color represents the p-value and the size of the box the odds ratio of the enrichment.
SELPHI is also displaying the phospho-profile behaviour of the subclusters. Hierarchical clustering of the sub-groups of your peptides can be downloaded it from the button below.
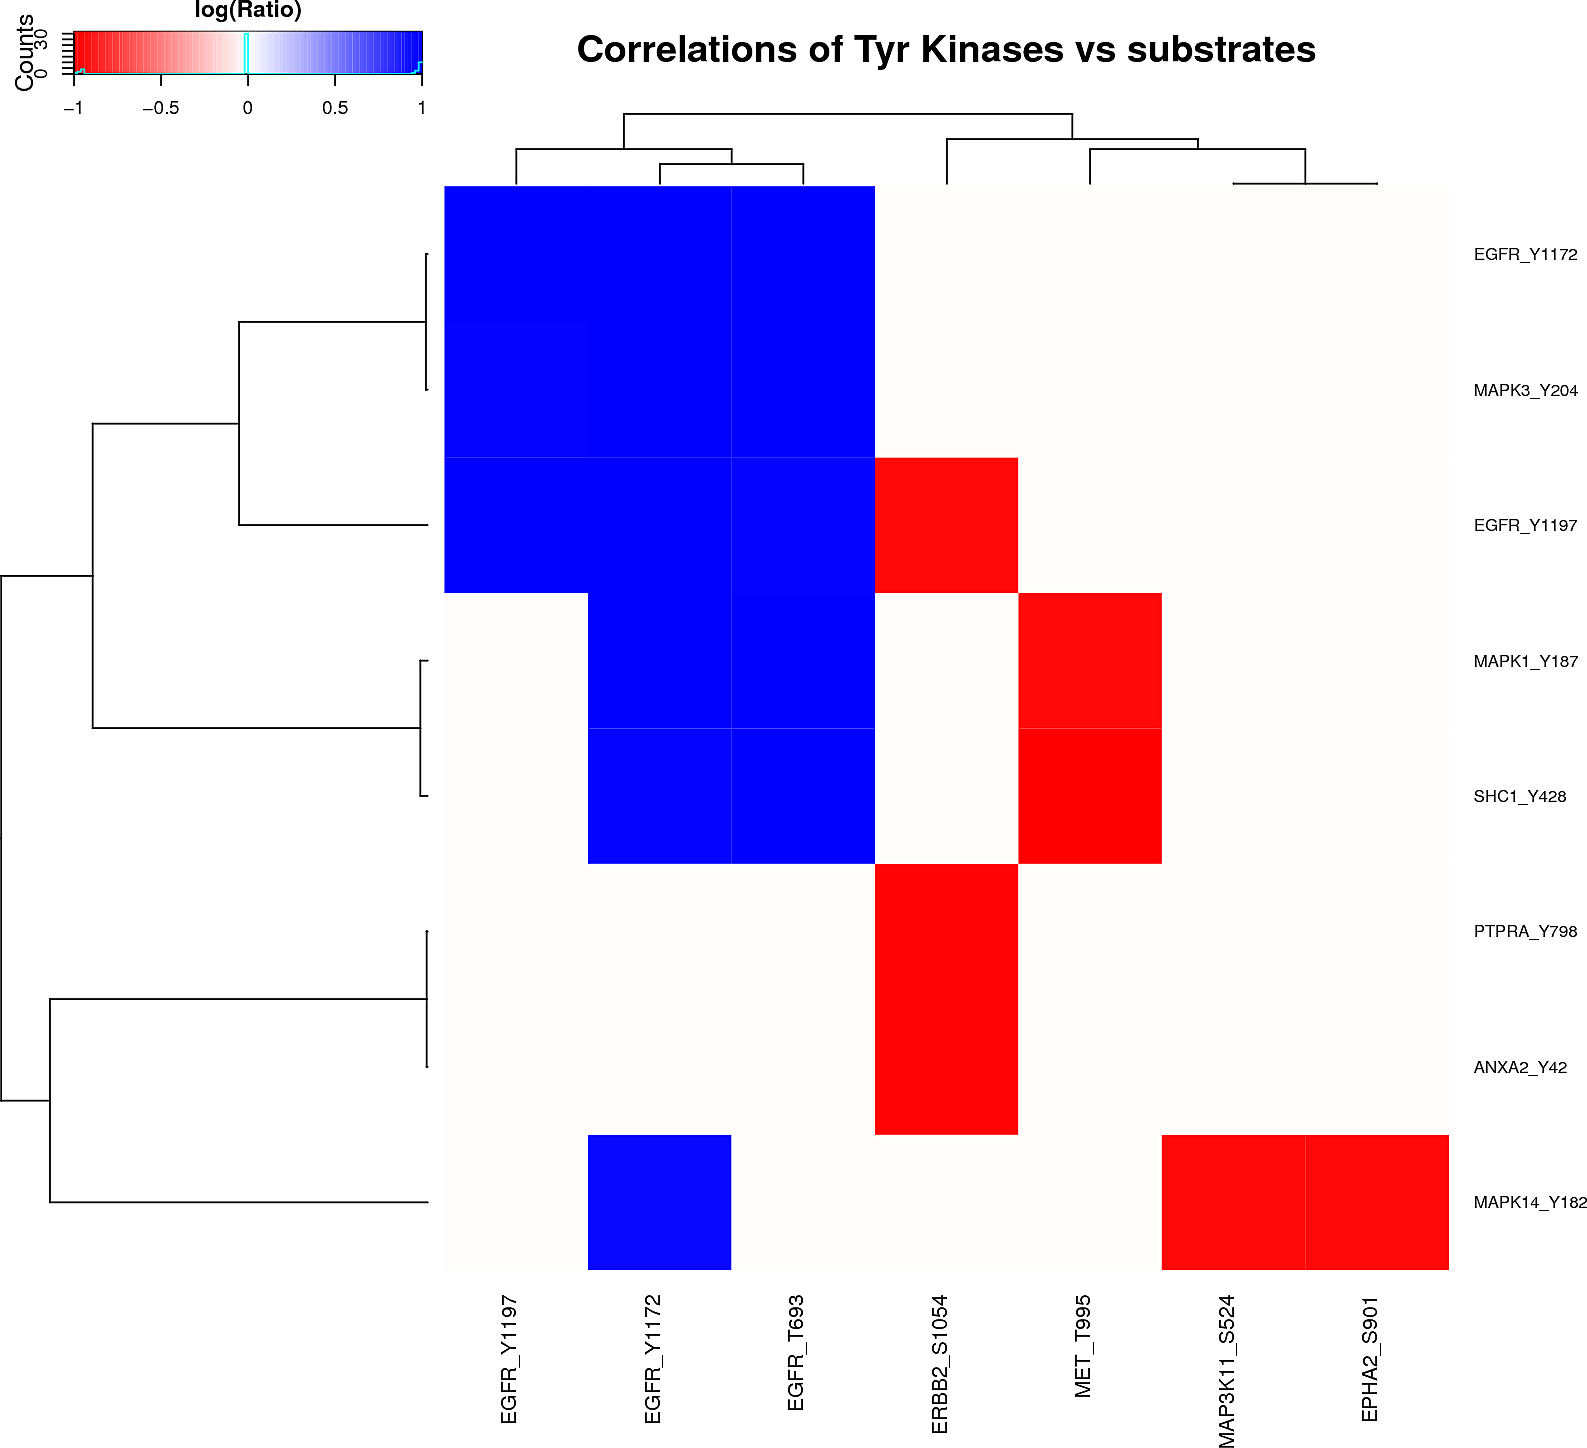
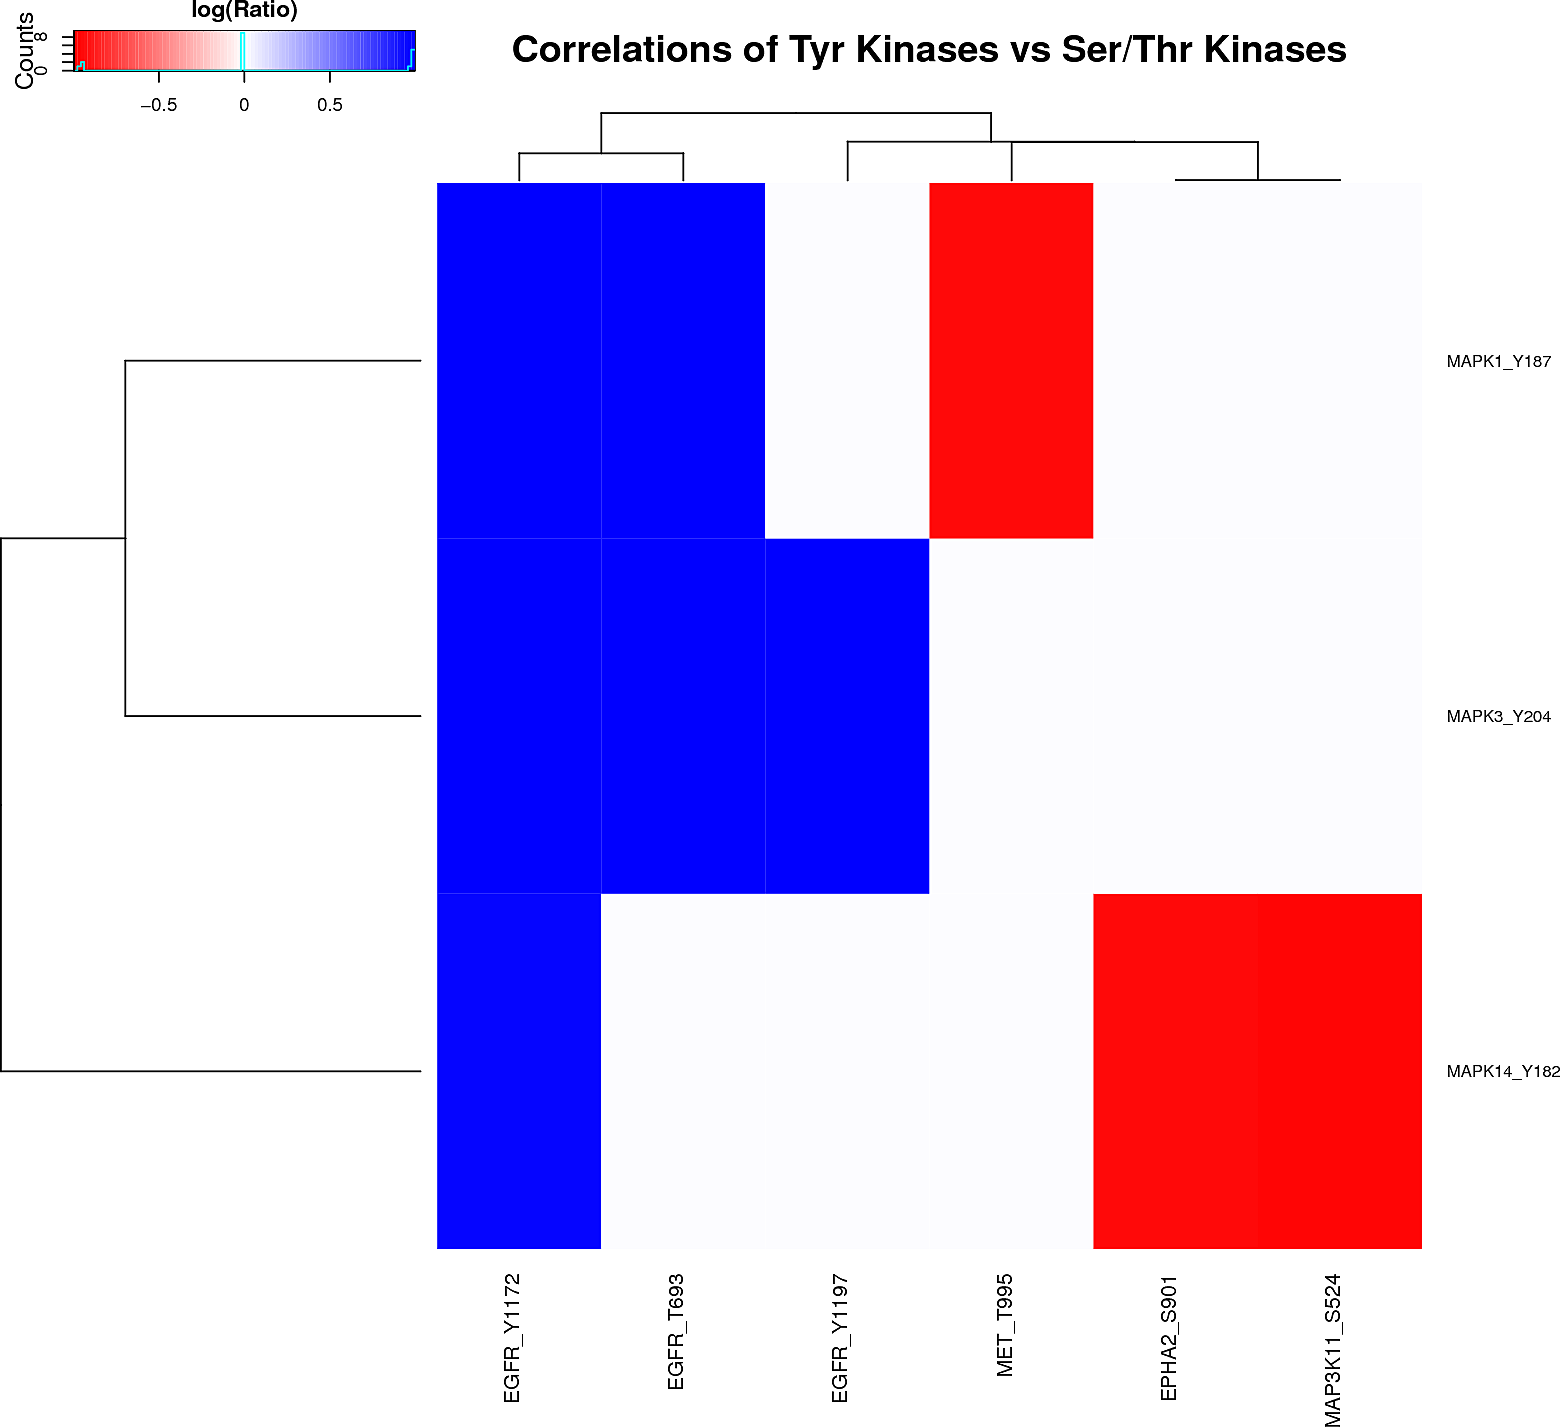
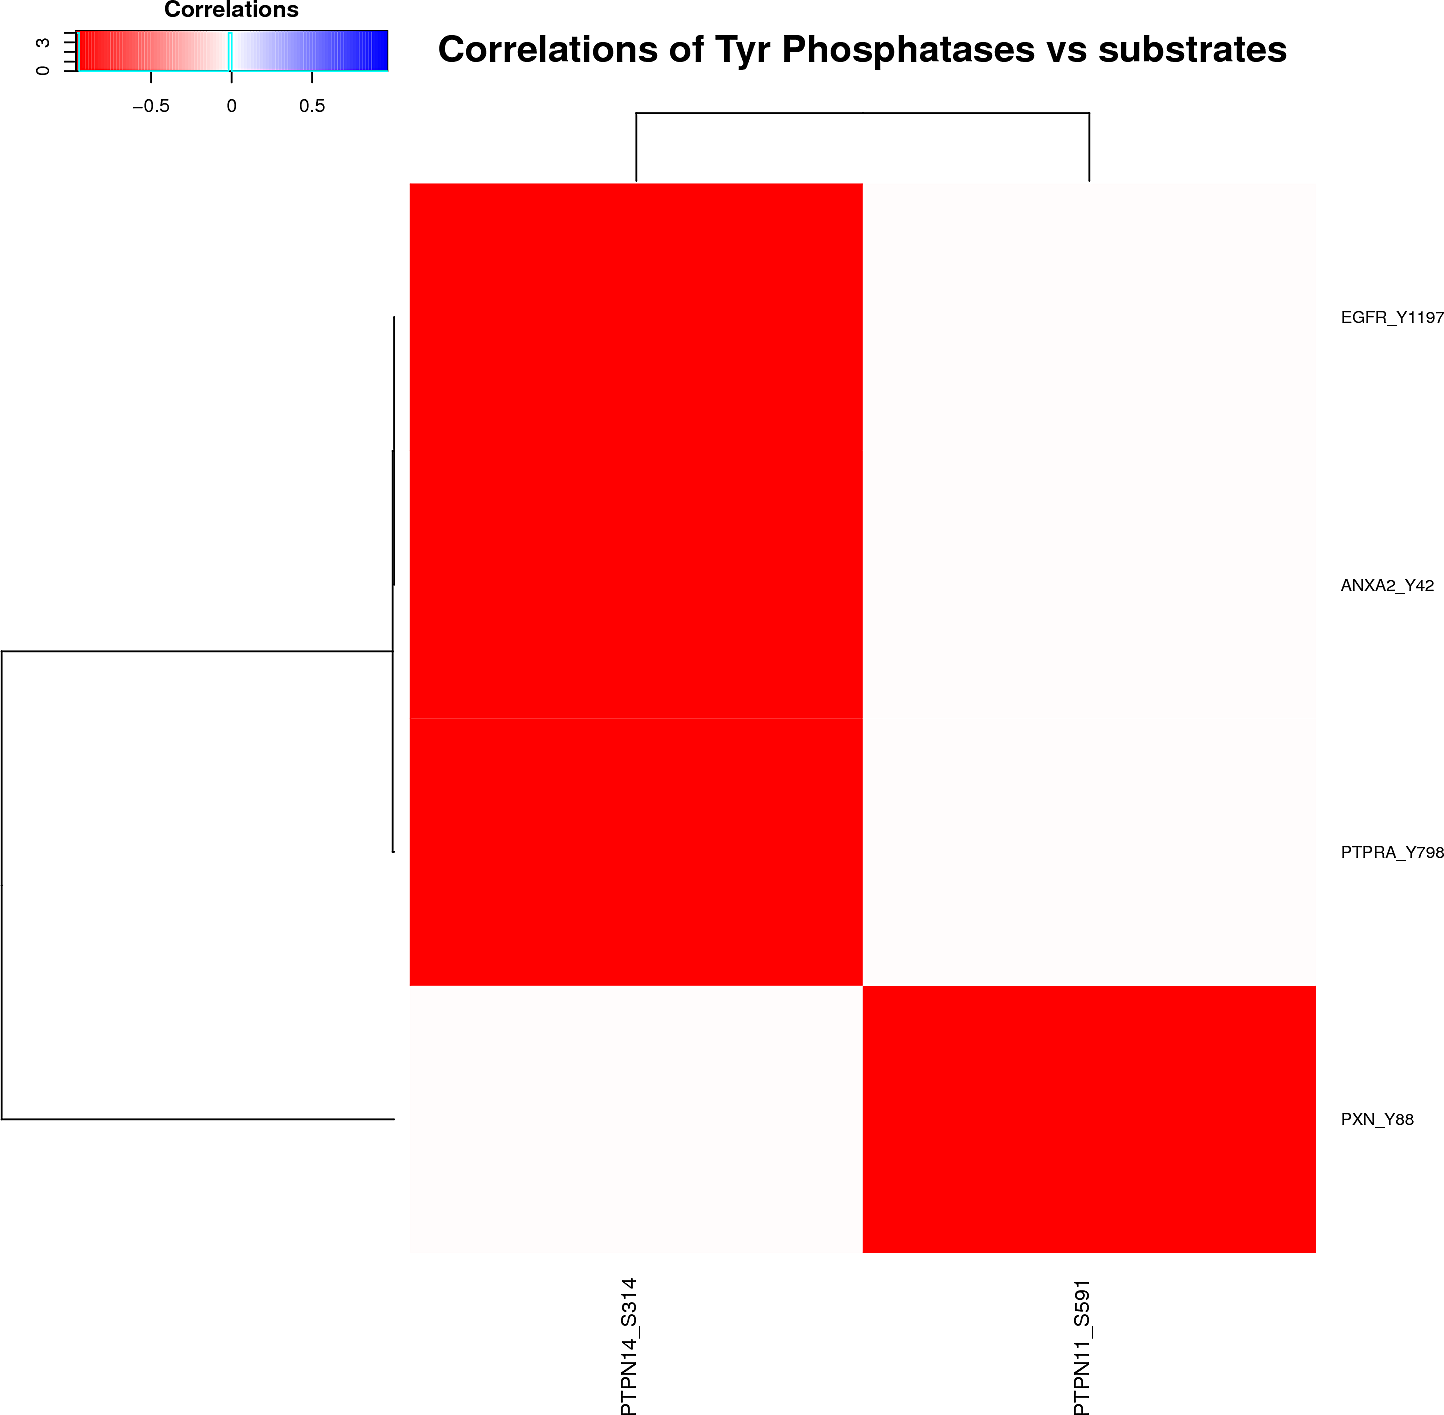
Kinase/Phosphatase-phosphopeptides relationships
Plots are only displayed for tyrosine kinases/phosphatases if applicable. Serine/Threonine Kinases/Phoshatases plots are available in the links below: